Published on 2 December 2025
Introduction
It looks like the debate about the costs and benefits of Brexit is being aired again, with much focus on the Office for Budget Responsibility statement that Brexit would cause a ‘long-run’ 4% loss of GDP.
The aims of this paper are:
- to help bring about a common understanding of what that means; and
- to put some real numbers around the scenario.
You can download this blog as a paper here.
Interpreting the statement
‘Long-run’ is taken to be 20 years, with the effect starting in 2021. The claim is interpreted as meaning that every year 0.2% of growth would be lost from what it would have been if the UK had remained in the EU. This would then mean that if GDP growth now were to be 1.6% in any one year, it would have been 1.8% if the UK had remained in the EU.
After 20 years of the accumulation of this annual give-up of 0.2%, the UK’s economy is 4% smaller than it would have been if the UK had remained in the EU.
UK GDP under ‘Out’ and ‘In’ scenarios
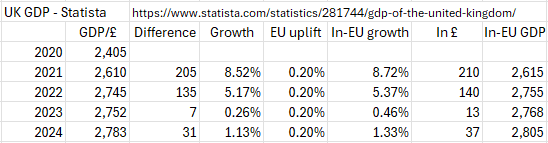
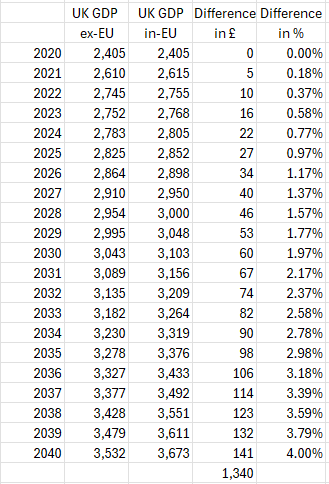
Starting with 2021, we can then work out what GDP would have been for 2021-4 if the UK had not left the EU, all in £billions:
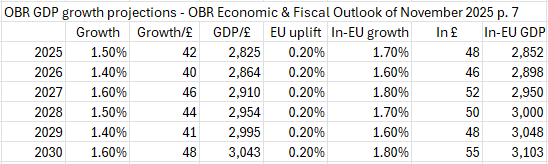
Basing ourselves on the latest OBR projections for economic growth in 2025-30, we can work out what GDP is projected to be up to and including 2030 if the UK were not outside the EU:
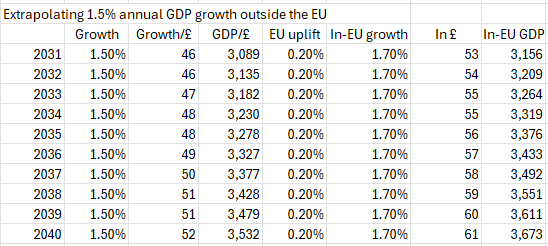
Then we can assume that the OBR’s trend line for 2025-30 is maintained from 2031-40:
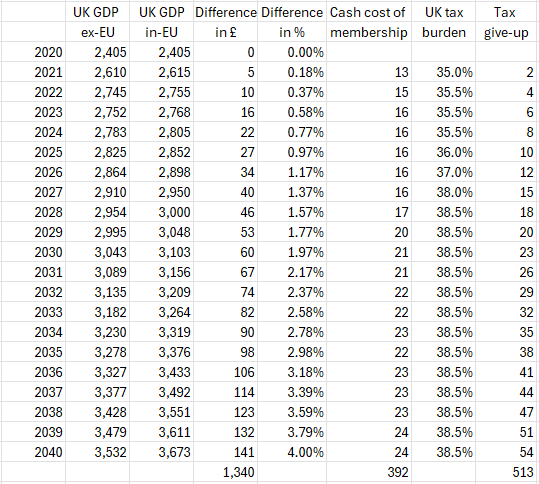
Finally we can draw up a combined picture from 2021-2040, and extrapolate that by the end of 2040 UK GDP would be higher by £1.34 trillion in the case of remaining in the EU:
Cost of membership
To give context to this figure, one should also project the cost of membership, on the narrow base of the financial obligations to pay entered into by the UK, minus the ‘rebate’ (actually an abatement of the obligation because it was deducted before money was paid) and minus the amount that flows back as grants and other payments from EU bodies into the UK.
The UK’s budget contribution equates to its share of EU GNI, which has been taken to be 12%, although the element that is the ‘Member state cash contribution’ has been subject to the rebate/abatement, bringing it down to about 8%.
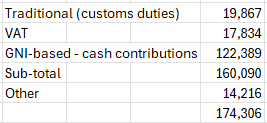
In 2020, the EU budget was EUR174 billion, as visible on the https://commission.europa.eu/strategy-and-policy/eu-budget/long-term-eu-budget/2014-2020/spending-and-revenue_en webpage.
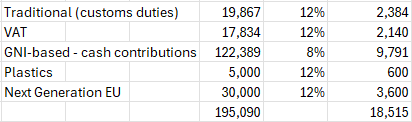
These are its ‘Own resources’ and include – under ‘Other’ – revenues made by itself, including taxes from EU staff salaries, bank interest, fines and contributions from third countries. The rest comes from the member states including Customs duties and VAT which belong legally to the EU but for which the member states act as collection agents (in EUR millions):
Based on that overall budget and the UK’s shares as stated earlier, the UK’s 2020 obligation should have been (in EUR millions):
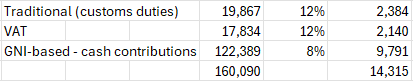
That EUR14.3 billion approximates to £13 billion for 2020.
Then we have the House of Commons Library study CBP-7886 of June 2022 ‘The UK’s contribution to the EU Budget’ p. 9, in £billions:
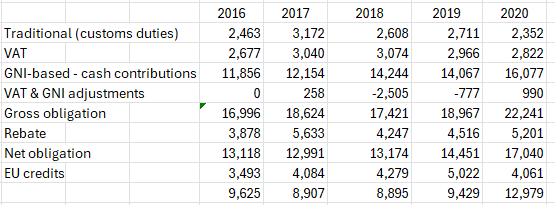
This bears out the previous calculation, namely that in 2020 the cost of membership was £13 billion per annum.
Drivers of future cost of membership
The future cost of membership would have been based on the settlements for the Multiannual Frameworks 2021-7, 2028-34, and the first six years of 2035-41.
It will be noted that the UK’s liability during 2016-20 was neither level, nor a steady rise, but a fall, then a rise, and then a significant rise for 2020 compared to 2019.
A plastics levy has been added as a new line of ‘Own resources’ starting in 2021. Putting a number against that has been an exercise in guesswork: EUR5 billion per annum, which is approximately ¼ of the ‘Own resources’ from Customs duties.
The MFFs for 2028-34 and 2035-41 are proposed by the European Commission to add further new lines of ‘Own resources’ to meet the debt repayments for the EUR750 billion Next Generation EU programme, which should be spread over 15 years (i.e. EUR50 billion per annum).
The EUR50 billion figure could in principle be reduced because 45% of the EUR750 billion was distributed as loans that should be repayable. However, defaults and fraud are expected to reduce loan repayments to 40%, adding 5% to the 55% of the programme that was distributed as grants. Thus 60% of the EUR750 billion will have to be found from ‘Own resources’ over a 15-year period, 14 years of which fall within the scope of this study. That is EUR30 billion per annum.
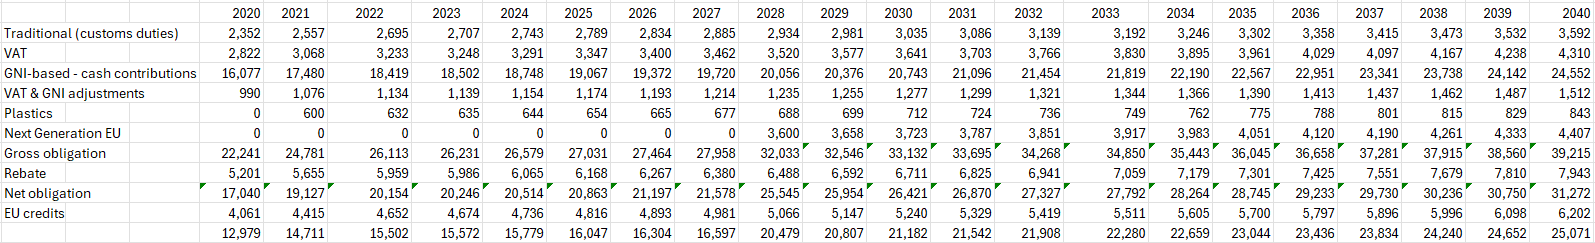
Here is how the UK’s contribution might have looked, based on the calculation of the likely outturn of 2020 as calculated above, with Plastics kicking in from 2021, and then Next Generation EU kicking in from 2028:
Assumptions used for the UK’s future cost of membership 2021-40
The assumptions made were:
- that the abatement and the credits back were retained;
- that the baseline for 2021 was the outcome of 2020;
- that all the amounts would escalate in line with the UK’s GDP growth as an EU member state, had the UK remained one.
If this third assumption had not been made, there would have been a risk of an exaggeration of benefits without a reflection of the associated costs.
UK’s future cost of membership 2021-40
The result is the following calculation in £millions:
Missing elements in the UK’s cost of membership
The cost of membership will no doubt be argued over, as it does not contain:
- the direct costs to the UK government and legal apparatus of managing membership (appointing and paying commissioners, MEPs, their costs, processing and codifying new EU regulations and directives etc.);
- the costs to UK businesses and public sector entities of adopting and complying with new EU regulations and directives etc.;
- the costs of Freedom of Movement (benefits and other publicly-funded support for citizens of other EU member states who come to the UK to live).
Loss of tax revenues
The final aspect is the loss of tax revenues. This should surely be based on the annual tax burden as a percentage of GDP, and therefore be directly calculated from the GDP figures.
The annual tax burden is an estimate, and has not been gone into in depth as to its applicability to trade with the EU.
The burden has been rising from 35% of GDP, and is set to rise further towards 38.5% of GDP.
Projected GDP along with UK’s future cost of membership 2021-40 and loss of tax revenues
This is the final table, in £billions, pulling together all the previous tables:
Summary
Under these calculations based upon the reading of the OBR statement laid out at the start:
- the UK economy would be larger by £1.34 trillion in 2040 than it will be given that the UK is not in the EU;
- that extra GDP would bring in an extra £513 billion in tax over the same period, if the average tax burden on the UK as a percentage of GDP is applied to this extra GDP;
- the net cost of membership would be £392 billion over the same period;
- the missing elements in the cost side appear, on the face of it, to be easier to list than any gaps in the financial benefits side, though possibly not quite as easy to proceed to put numbers against.
Next steps
Is this what those who campaign for the UK to re-join the UK understand by the OBR claim?
Do the numbers contained in this paper bear a resemblance to the numbers they would calculate themselves?
If so, then at least we have a common basis upon which to pursue a discussion.
If not, what are the differences?